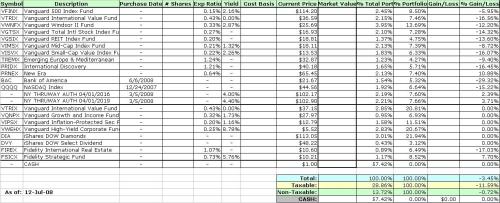
I’ve been meaning to create an Excel portfolio tracker for quite some time now, and with a little goading from my friend I’ve finally done it. This is merely the first draft and it certainly could use quite a bit of fine-tuning, but I think it is a good start. I’ve entered in all my taxable holdings, but only about 1/4 of my tax deferred holdings. I’m still trying to figure out how to “easily” track my company’s 401K offerings.
As you can see (and now I can see), I have most of my holdings in cash (again, not all the 401K is there, so the numbers are a bit skewed). Also, I’m down quite a bit on most of my holdings…Bank of America was obviously a bad bet. My next goal is to completely enter all my holdings (401K) and do a full analysis on the allocations.
Here is the spreadsheet (Excel) that I created to track my portfolio. The first tab is where you enter your holdings, expense ratio, cost basis, etc. All the columns after Cost Basis are auto-generated. On the second tab is the market data grabbed from MSN Money and populated in the Market Value column. You can enter your own symbols by selecting Data->Get External Data->Parameters. The second radio button on the pop-up (Excel 2008 Mac at least) allows you to enter your symbols separated by commas. To get the latest data, just select Data->Refresh Data. There are two groupings of market data, one for taxable and one for tax deferred. I found this easier to maintain this way.
**Due to restictions on WordPress, I had to rename the Excel (.xls) file to .doc. Please download the file and rename it from .doc to .xls.**
